
netcup wiki
Server

Statistics
This page provides you with detailed information on your server's current state and health. Here you can see how much CPU power, hard disk operations, network packets per second and traffic your server is processing over a timeframe of up to 31 days. Using the section in the top right, you can change between different sections, depending on the type of information you want to view.
You can export data provided by the "Statistics" panel using the hamburger menu at the right. The data can be exported here in either PNG or SVG format.
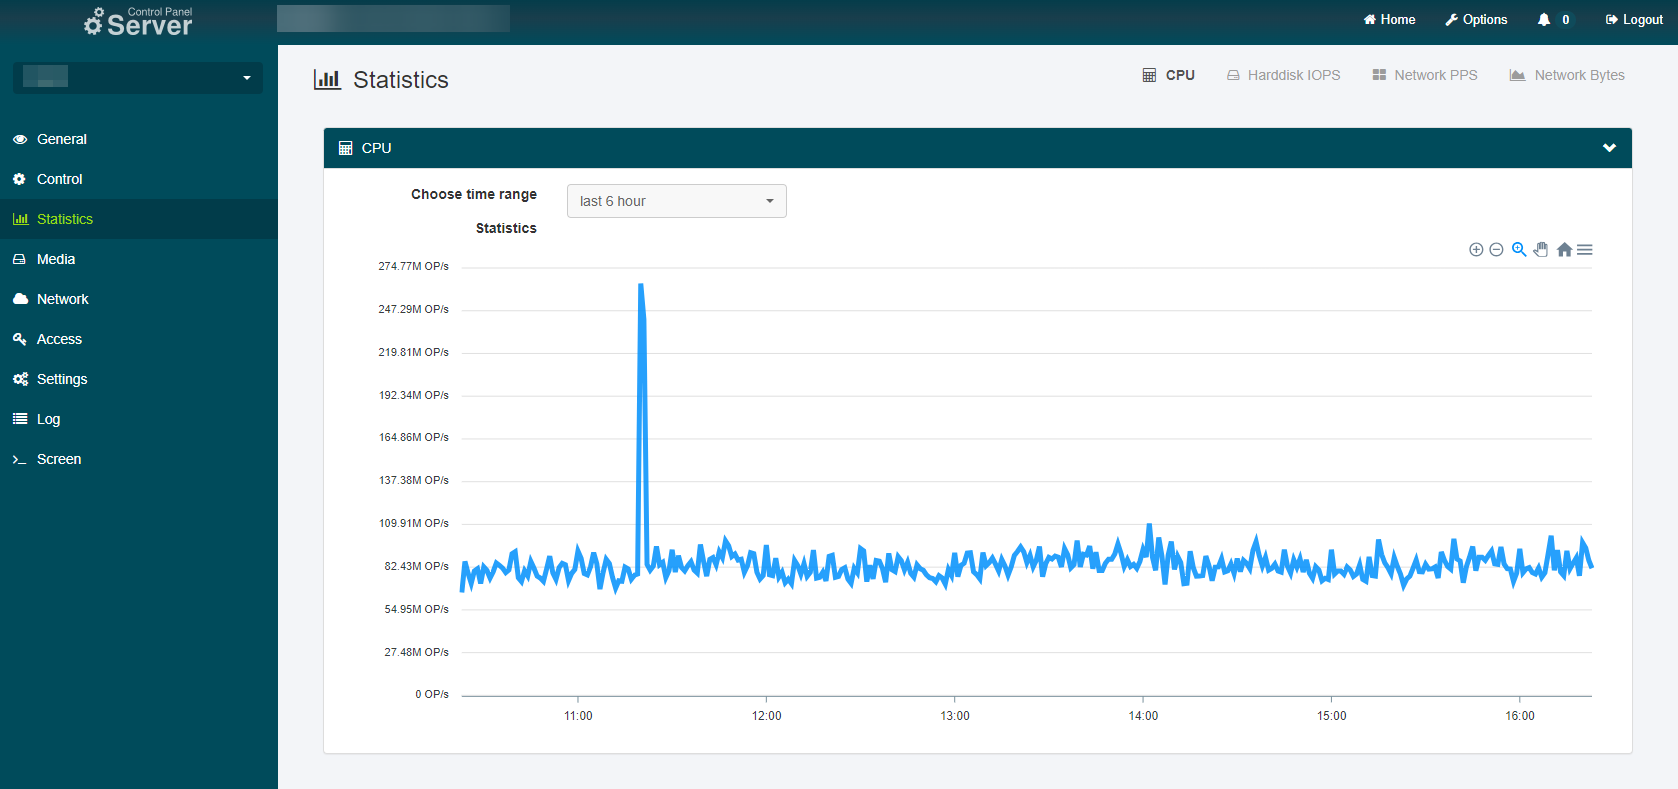
CPU
In this section, the graph shows you how many available processing resources the server was using at a given time. The unit used here is CPU operations per second, and the graph is divided by CPU cores. Depending on the task, you may see the processor being loaded by one, two, or more cores.
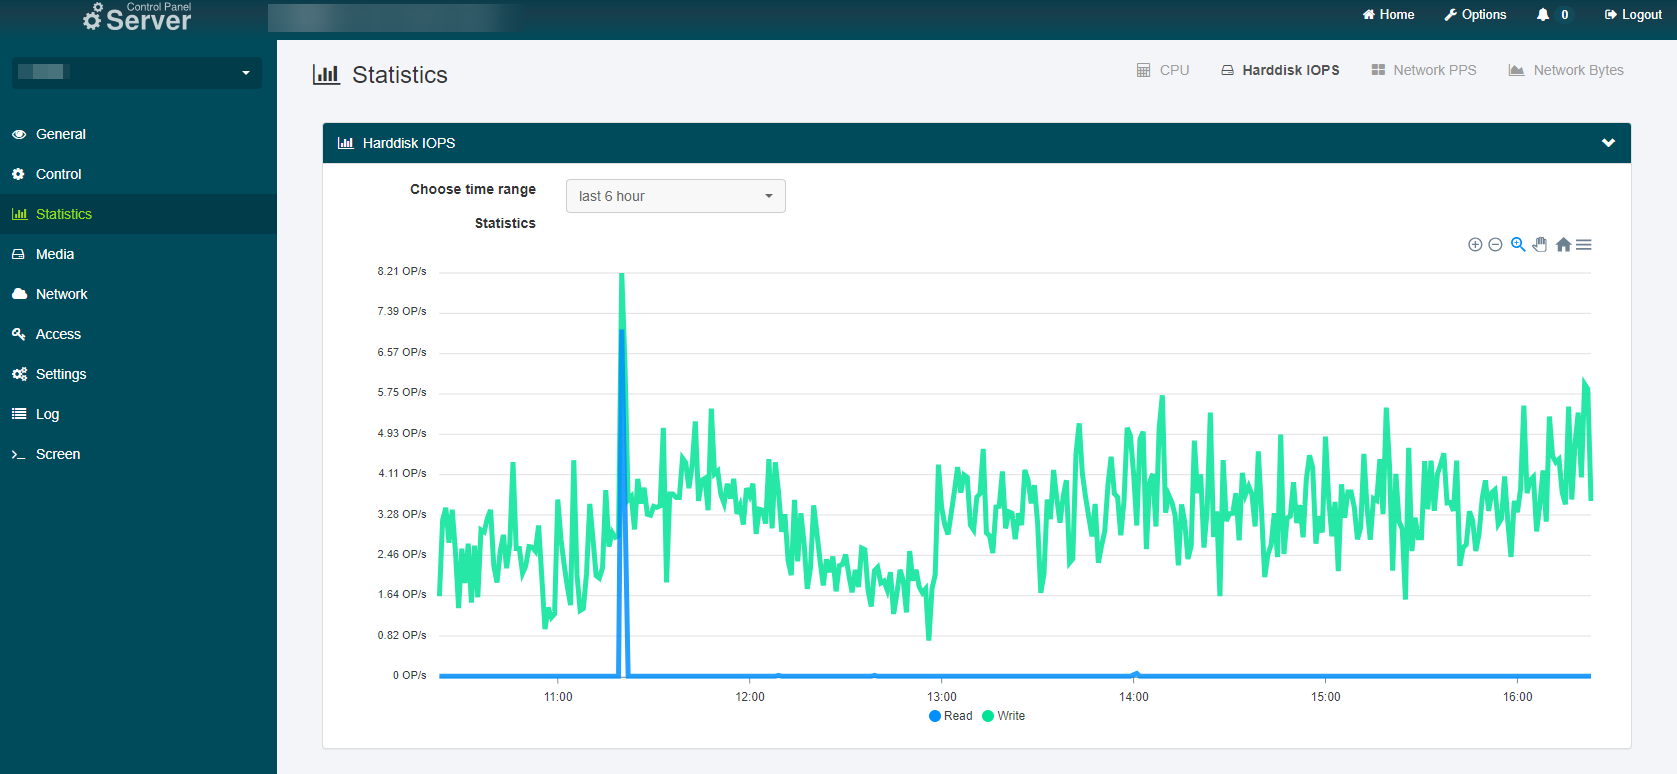
Harddisk IOPS
In this section, the graph shows you the disk transfers that your server had to process at a given time. The blue line shows you the read operations, the green line all the write operations. This is measured in hard disk operations per second.
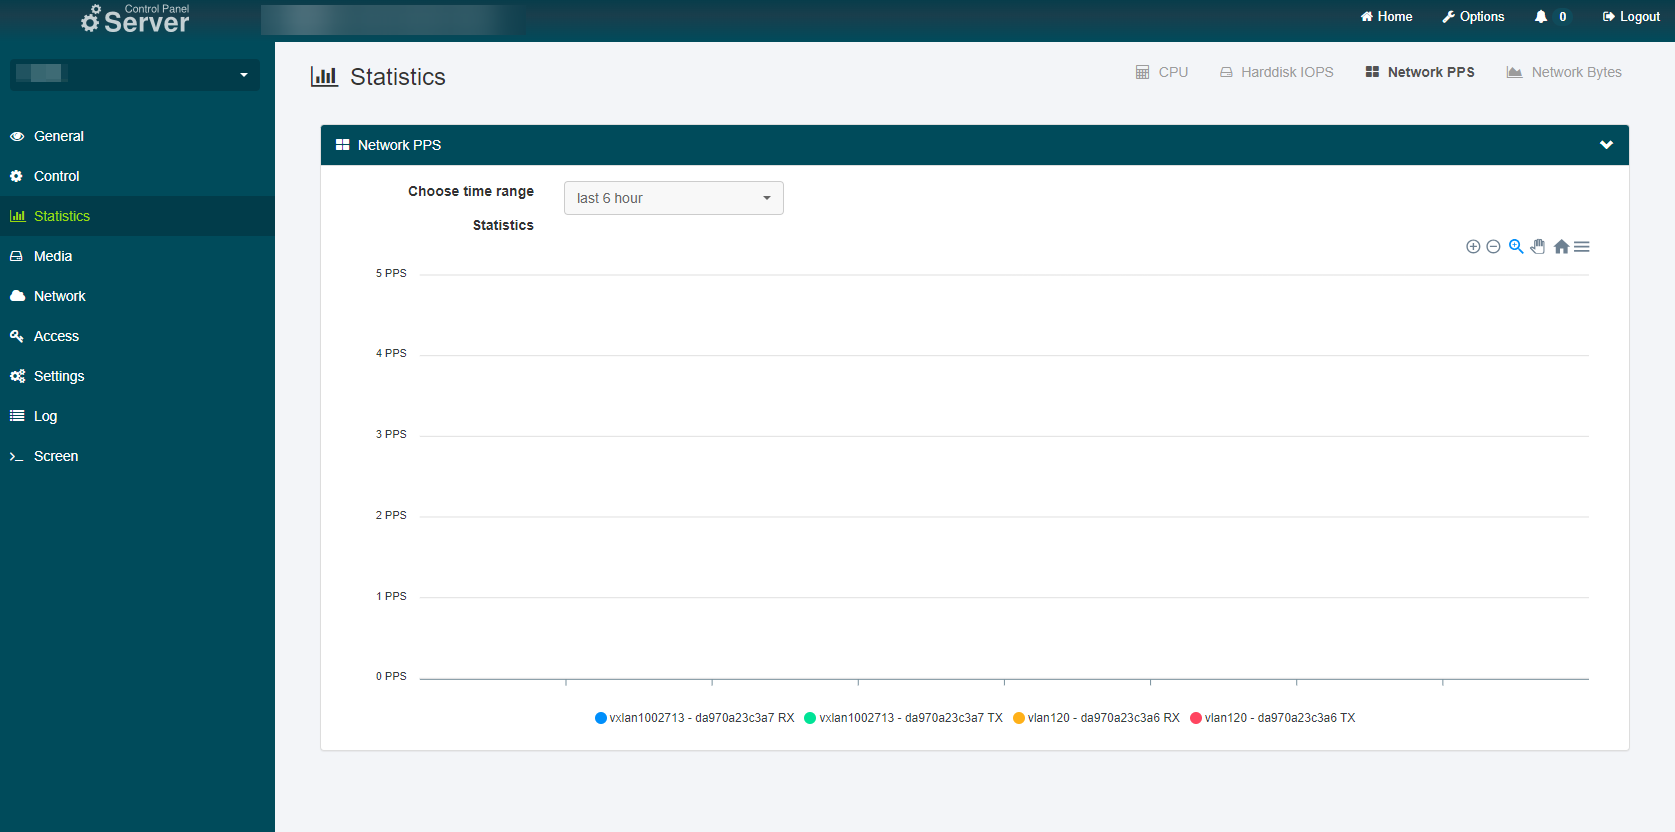
Network PPS
In this section, the graph shows you how many network packages your server has sent or received at a given time. The blue line (RX) represents inbound packages, the green line (TX) outbound packages. This is measured in packages per second.
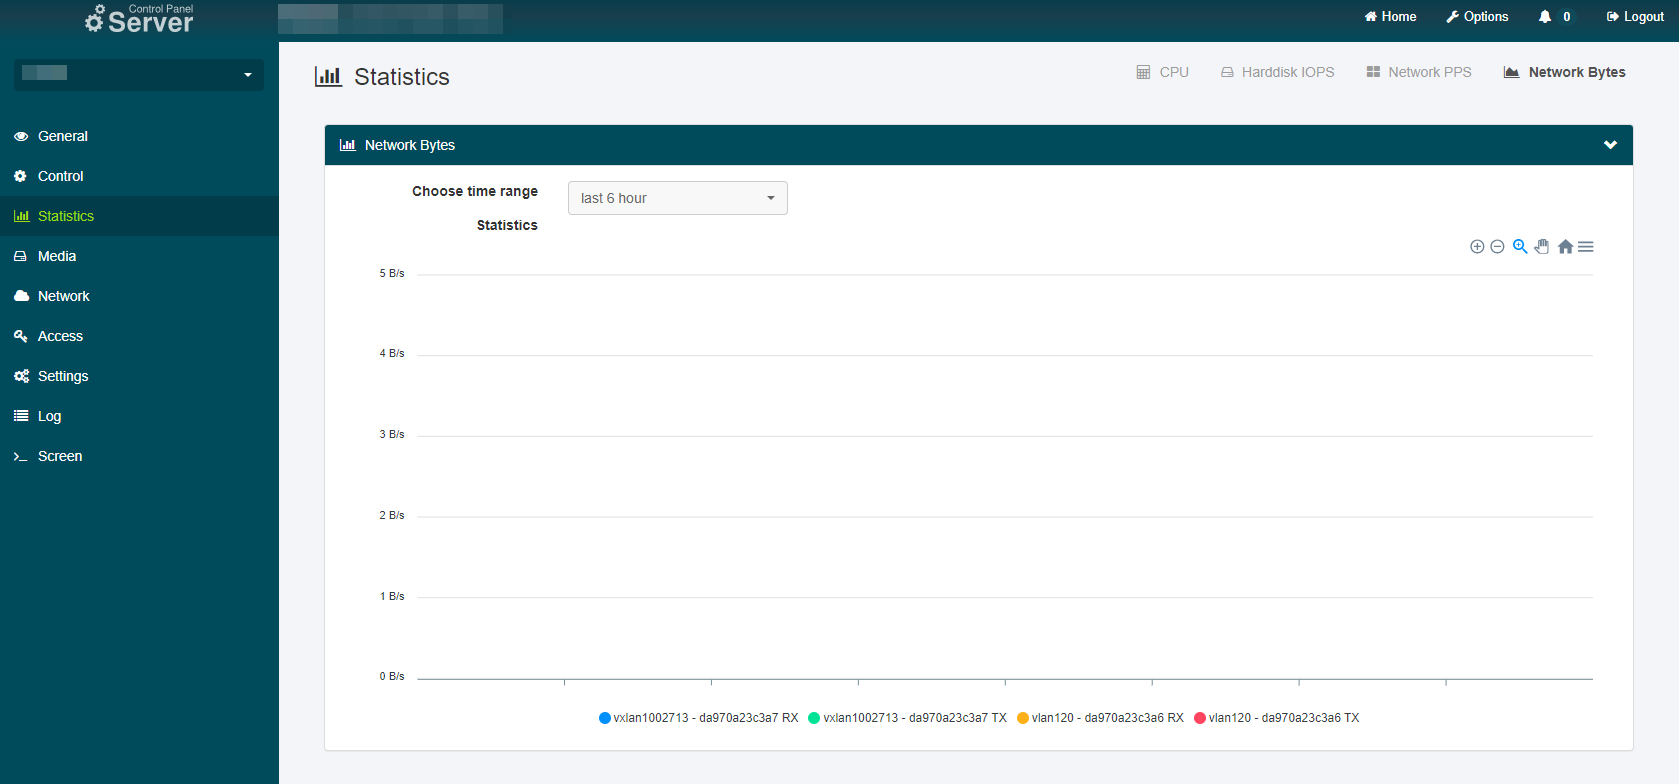
Network Bytes
In this section, the graph shows you how much network traffic your server has sent or received at a given time. The blue line (RX) represents inbound traffic, the green line (TX) outbound traffic. This is measured in bytes per second.
netcup
netcup Enterprise
Community
netcup Enterprise
Community